
Assignment - Blog Post 0
In this blog post assignment (homework), I create a short post for my new website. The primary purpose is to practice working with Jekyll blogging with Python code.
Import the data
import numpy as np
from matplotlib import pyplot as plt
import seaborn as sns
import pandas as pd
url = "https://raw.githubusercontent.com/PhilChodrow/PIC16B/master/datasets/palmer_penguins.csv"
penguins = pd.read_csv(url)
#Then, we briefly overview all the penguins
penguins
| studyName | Sample Number | Species | Region | Island | Stage | Individual ID | Clutch Completion | Date Egg | Culmen Length (mm) | Culmen Depth (mm) | Flipper Length (mm) | Body Mass (g) | Sex | Delta 15 N (o/oo) | Delta 13 C (o/oo) | Comments | |
|---|---|---|---|---|---|---|---|---|---|---|---|---|---|---|---|---|---|
| 0 | PAL0708 | 1 | Adelie Penguin (Pygoscelis adeliae) | Anvers | Torgersen | Adult, 1 Egg Stage | N1A1 | Yes | 11/11/07 | 39.1 | 18.7 | 181.0 | 3750.0 | MALE | NaN | NaN | Not enough blood for isotopes. |
| 1 | PAL0708 | 2 | Adelie Penguin (Pygoscelis adeliae) | Anvers | Torgersen | Adult, 1 Egg Stage | N1A2 | Yes | 11/11/07 | 39.5 | 17.4 | 186.0 | 3800.0 | FEMALE | 8.94956 | -24.69454 | NaN |
| 2 | PAL0708 | 3 | Adelie Penguin (Pygoscelis adeliae) | Anvers | Torgersen | Adult, 1 Egg Stage | N2A1 | Yes | 11/16/07 | 40.3 | 18.0 | 195.0 | 3250.0 | FEMALE | 8.36821 | -25.33302 | NaN |
| 3 | PAL0708 | 4 | Adelie Penguin (Pygoscelis adeliae) | Anvers | Torgersen | Adult, 1 Egg Stage | N2A2 | Yes | 11/16/07 | NaN | NaN | NaN | NaN | NaN | NaN | NaN | Adult not sampled. |
| 4 | PAL0708 | 5 | Adelie Penguin (Pygoscelis adeliae) | Anvers | Torgersen | Adult, 1 Egg Stage | N3A1 | Yes | 11/16/07 | 36.7 | 19.3 | 193.0 | 3450.0 | FEMALE | 8.76651 | -25.32426 | NaN |
| ... | ... | ... | ... | ... | ... | ... | ... | ... | ... | ... | ... | ... | ... | ... | ... | ... | ... |
| 339 | PAL0910 | 120 | Gentoo penguin (Pygoscelis papua) | Anvers | Biscoe | Adult, 1 Egg Stage | N38A2 | No | 12/1/09 | NaN | NaN | NaN | NaN | NaN | NaN | NaN | NaN |
| 340 | PAL0910 | 121 | Gentoo penguin (Pygoscelis papua) | Anvers | Biscoe | Adult, 1 Egg Stage | N39A1 | Yes | 11/22/09 | 46.8 | 14.3 | 215.0 | 4850.0 | FEMALE | 8.41151 | -26.13832 | NaN |
| 341 | PAL0910 | 122 | Gentoo penguin (Pygoscelis papua) | Anvers | Biscoe | Adult, 1 Egg Stage | N39A2 | Yes | 11/22/09 | 50.4 | 15.7 | 222.0 | 5750.0 | MALE | 8.30166 | -26.04117 | NaN |
| 342 | PAL0910 | 123 | Gentoo penguin (Pygoscelis papua) | Anvers | Biscoe | Adult, 1 Egg Stage | N43A1 | Yes | 11/22/09 | 45.2 | 14.8 | 212.0 | 5200.0 | FEMALE | 8.24246 | -26.11969 | NaN |
| 343 | PAL0910 | 124 | Gentoo penguin (Pygoscelis papua) | Anvers | Biscoe | Adult, 1 Egg Stage | N43A2 | Yes | 11/22/09 | 49.9 | 16.1 | 213.0 | 5400.0 | MALE | 8.36390 | -26.15531 | NaN |
344 rows × 17 columns
We select the columns that might be used:
penguins = penguins[["Species",'Island',"Culmen Length (mm)",
                     "Culmen Depth (mm)","Flipper Length (mm)",
    "Body Mass (g)", "Delta 15 N (o/oo)", "Delta 13 C (o/oo)"]]
penguins
| Species | Island | Culmen Length (mm) | Culmen Depth (mm) | Flipper Length (mm) | Body Mass (g) | Delta 15 N (o/oo) | Delta 13 C (o/oo) | |
|---|---|---|---|---|---|---|---|---|
| 0 | Adelie Penguin (Pygoscelis adeliae) | Torgersen | 39.1 | 18.7 | 181.0 | 3750.0 | NaN | NaN |
| 1 | Adelie Penguin (Pygoscelis adeliae) | Torgersen | 39.5 | 17.4 | 186.0 | 3800.0 | 8.94956 | -24.69454 |
| 2 | Adelie Penguin (Pygoscelis adeliae) | Torgersen | 40.3 | 18.0 | 195.0 | 3250.0 | 8.36821 | -25.33302 |
| 3 | Adelie Penguin (Pygoscelis adeliae) | Torgersen | NaN | NaN | NaN | NaN | NaN | NaN |
| 4 | Adelie Penguin (Pygoscelis adeliae) | Torgersen | 36.7 | 19.3 | 193.0 | 3450.0 | 8.76651 | -25.32426 |
| ... | ... | ... | ... | ... | ... | ... | ... | ... |
| 339 | Gentoo penguin (Pygoscelis papua) | Biscoe | NaN | NaN | NaN | NaN | NaN | NaN |
| 340 | Gentoo penguin (Pygoscelis papua) | Biscoe | 46.8 | 14.3 | 215.0 | 4850.0 | 8.41151 | -26.13832 |
| 341 | Gentoo penguin (Pygoscelis papua) | Biscoe | 50.4 | 15.7 | 222.0 | 5750.0 | 8.30166 | -26.04117 |
| 342 | Gentoo penguin (Pygoscelis papua) | Biscoe | 45.2 | 14.8 | 212.0 | 5200.0 | 8.24246 | -26.11969 |
| 343 | Gentoo penguin (Pygoscelis papua) | Biscoe | 49.9 | 16.1 | 213.0 | 5400.0 | 8.36390 | -26.15531 |
344 rows × 8 columns
Observing the data
Now, by observing that there are certain number of species and islands of penguins, it might be great to know how many different species and islands are there in the dataset. This would help in observing the characteristics of the penguins when creating further plots, and possibly observing some patterns. The unique function gives the unique elements of an array, and in this case, gives the unique elements through a column.
penguins["Island"].unique()
array(['Torgersen', 'Biscoe', 'Dream'], dtype=object)
penguins["Species"].unique()
array(['Adelie Penguin (Pygoscelis adeliae)',
       'Chinstrap penguin (Pygoscelis antarctica)',
       'Gentoo penguin (Pygoscelis papua)'], dtype=object)
Preprocess the data
We drop the Nan values with the dropna function:
penguins = penguins.dropna()
penguins
| Species | Island | Culmen Length (mm) | Culmen Depth (mm) | Flipper Length (mm) | Body Mass (g) | Delta 15 N (o/oo) | Delta 13 C (o/oo) | |
|---|---|---|---|---|---|---|---|---|
| 1 | Adelie Penguin (Pygoscelis adeliae) | Torgersen | 39.5 | 17.4 | 186.0 | 3800.0 | 8.94956 | -24.69454 |
| 2 | Adelie Penguin (Pygoscelis adeliae) | Torgersen | 40.3 | 18.0 | 195.0 | 3250.0 | 8.36821 | -25.33302 |
| 4 | Adelie Penguin (Pygoscelis adeliae) | Torgersen | 36.7 | 19.3 | 193.0 | 3450.0 | 8.76651 | -25.32426 |
| 5 | Adelie Penguin (Pygoscelis adeliae) | Torgersen | 39.3 | 20.6 | 190.0 | 3650.0 | 8.66496 | -25.29805 |
| 6 | Adelie Penguin (Pygoscelis adeliae) | Torgersen | 38.9 | 17.8 | 181.0 | 3625.0 | 9.18718 | -25.21799 |
| ... | ... | ... | ... | ... | ... | ... | ... | ... |
| 338 | Gentoo penguin (Pygoscelis papua) | Biscoe | 47.2 | 13.7 | 214.0 | 4925.0 | 7.99184 | -26.20538 |
| 340 | Gentoo penguin (Pygoscelis papua) | Biscoe | 46.8 | 14.3 | 215.0 | 4850.0 | 8.41151 | -26.13832 |
| 341 | Gentoo penguin (Pygoscelis papua) | Biscoe | 50.4 | 15.7 | 222.0 | 5750.0 | 8.30166 | -26.04117 |
| 342 | Gentoo penguin (Pygoscelis papua) | Biscoe | 45.2 | 14.8 | 212.0 | 5200.0 | 8.24246 | -26.11969 |
| 343 | Gentoo penguin (Pygoscelis papua) | Biscoe | 49.9 | 16.1 | 213.0 | 5400.0 | 8.36390 | -26.15531 |
330 rows × 8 columns
Creating some plots
Now we see that all penguins could be classified into three species, and they dwell three islands(the species and islands might not be corresponded). First off, it might be helpful to create some plots demonstrating whether some features of each of these species corresponds with certain islands or species.
The following plot inspects whether culmen length and culmen depth could together show some pattern for different species.
#relplot plot the relationship between two variables
#the first two parameters are variables for relationship eval,
#the third one indicates the data to use,
#and the last parameter 'hue' specifies which feature to use to cluster the penguins
sns.relplot("Culmen Length (mm)", "Culmen Depth (mm)",
            data = penguins, hue = 'Island')
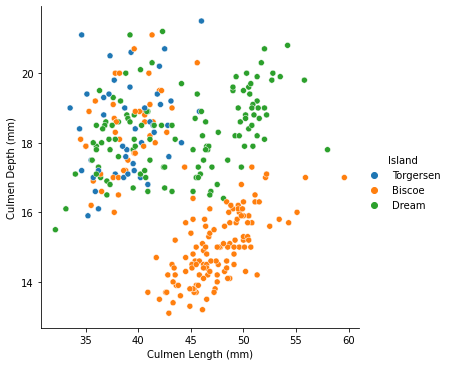
Oops, it seems like culmen length and culmen depth could not separate out penguins on islands. This is to say, regardless of some patterns, there are penguins for culmen length < 45mm and culmen depth > 16mm on each island.
Next, we check for the same features, but cluster the penguins by species.
sns.relplot("Culmen Length (mm)", "Culmen Depth (mm)",
            data = penguins, hue = 'Species', size_norm = (5,5))
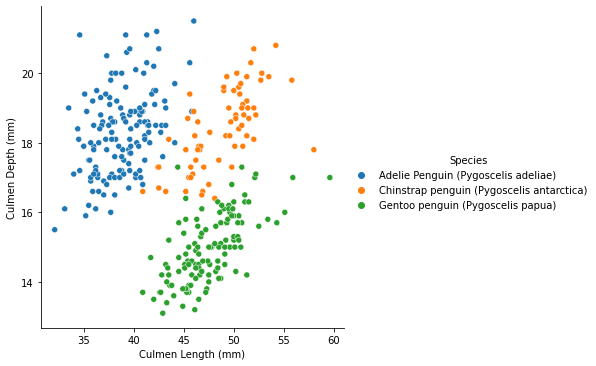
Surprisingly, the above figure demonstrates that each of the species has its own cluster for culmen length and depth combination.
Space Holder
Space Holder