
Blog Post 0
In this blog post assignment (homework), you’ll create a short post for your new website. The primary purpose is to give you some practice working with Jekyll blogging with Python code.
§0. Fork
To complete this homework assignment, you’ll need to have completed installations of Anaconda, GitHub Desktop, and Jekyll as described in this post.
§1. Complete the Hello Jekyll activity
Your first step should be to complete the Hello Jekyll activity to help you get familiar with blogging with Jekyll. If you already completed this activity in Discussion, then you can skip to the next step.
If you haven’t already, now is a good time to modify your site. Look around the site’s files and see if you can figure out how to:
- Change your avatar (picture at the top left corner).
- Change your blog’s title (currently “My PIC16B Blog”) and byline (currently “Awesome Python Student”).
- If you’d like to, you can include a bit about yourself on the “About” page.
All this is optional, and it’s not necessary to put your real name or real photo anywhere on the site.
Hint: Most website options are controlled by the file _config.yml:
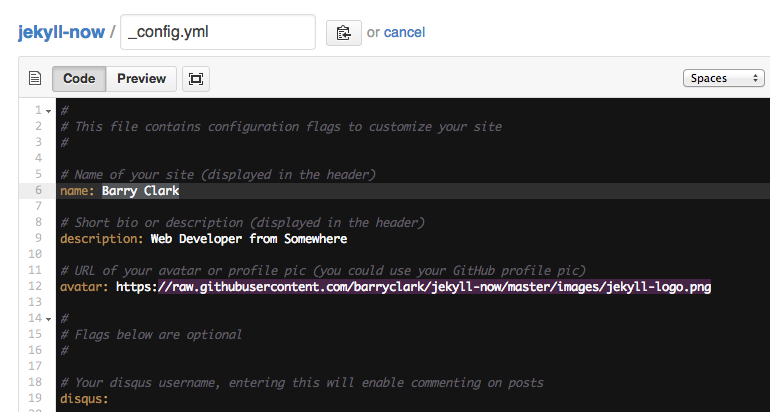
Modifying Appearance
There are many ways to modify the appearance of your website. If you are comfortable with css, then you can directly modify style.scss and other files in the repo. If you want to get fancier, you can look into migrating to one of the many available themes in the Jekyll theme gallery. Please note that, while theming your website can be fun and satisfying, it is outside the scope of the course. As a consequence, neither I nor the TA can help you troubleshoot your website if you are using a theme. Proceed at your own risk!
§2. Create a post!
Create a simple blog post, using the instructions and demonstrations here. Here is the prompt for your post:
Write a tutorial explaining how to construct an interesting data visualization of the Palmer Penguins data set.
You can read the data into Python by running:
import pandas as pd
url = "https://raw.githubusercontent.com/PhilChodrow/PIC16B/master/datasets/palmer_penguins.csv"
penguins = read_csv(url)
Your visualization does not have to be complex or fancy, but it should be highly readable and appropriately labeled. Here are the requirements for your post:
- Your post should have lots of explanatory text. Your goal is to explain to someone how to create the visualization! Make sure to explain the usage of tools from
pandasormatplotlib, for example. - Your post should include all the code needed to construct the visualization. Show us everything!
- Your post should include the image directly under the code that generates it, as demonstrated here and here.
- Your post should include the use of the
got-helpandgave-helpenvironments demonstrated here and here. Feel free to put some filler text within these environments, since you won’t be giving or receiving peer feedback on this assignment.
Commit and push your post to publish it to the web. Your assignment is not complete until it is a live blog post on the internet!
On CCLE, submit a link to your published post.
Hint
The easiest way to create a post like this is to solve the problem in a Jupyter Notebook first, and then transfer the results over to your blog.